|
|
|
|
|
Rolling Hills Gin
Market Data
News
Ag Commentary
Weather
Resources
|

Elliott Wave Expects $AUDUSD to Break Higher
Short Term Elliott Wave in (AUDUSD) suggests the pullback to 0.636 ended wave (2). The pair has turned higher in wave (3) with internal subdivision in 5 waves in lesser degree. Up from wave (2), wave (i) ended at 0.6432 and pullback in wave (ii) ended at 0.6407. The pair then extended higher in wave (iii) towards 0.655 and dips in wave (iv) ended at 0.6516. Final leg wave (v) higher ended at 0.6586 and this completed wave ((i)). Pullback in wave ((ii)) ended at 0.6464. Up from there, wave (i) ended at 0.654 and pullback in wave (ii) ended at 0.65. Pair resumed higher in wave (iii) towards 0.6647 and dips in wave (iv) ended at 0.662. Pair then extended higher 1 more leg in wave (v) to 0.6649 which completed wave ((iii)). Pullback in wave ((iv)) unfolded as a zigzag Elliott Wave structure. Down from wave ((iii)), wave (a) ended at 0.66 and wave (b) rally ended at 0.6644. Pair then extended lower in wave (c) towards 0.6657 which completed wave ((iv)). Near term, as far as pivot on 4.19.2024 low at 0.636 stays intact, expect dips to find support in 3, 7, or 11 swing for further upside. AUDUSD 60 Minutes Elliott Wave Chart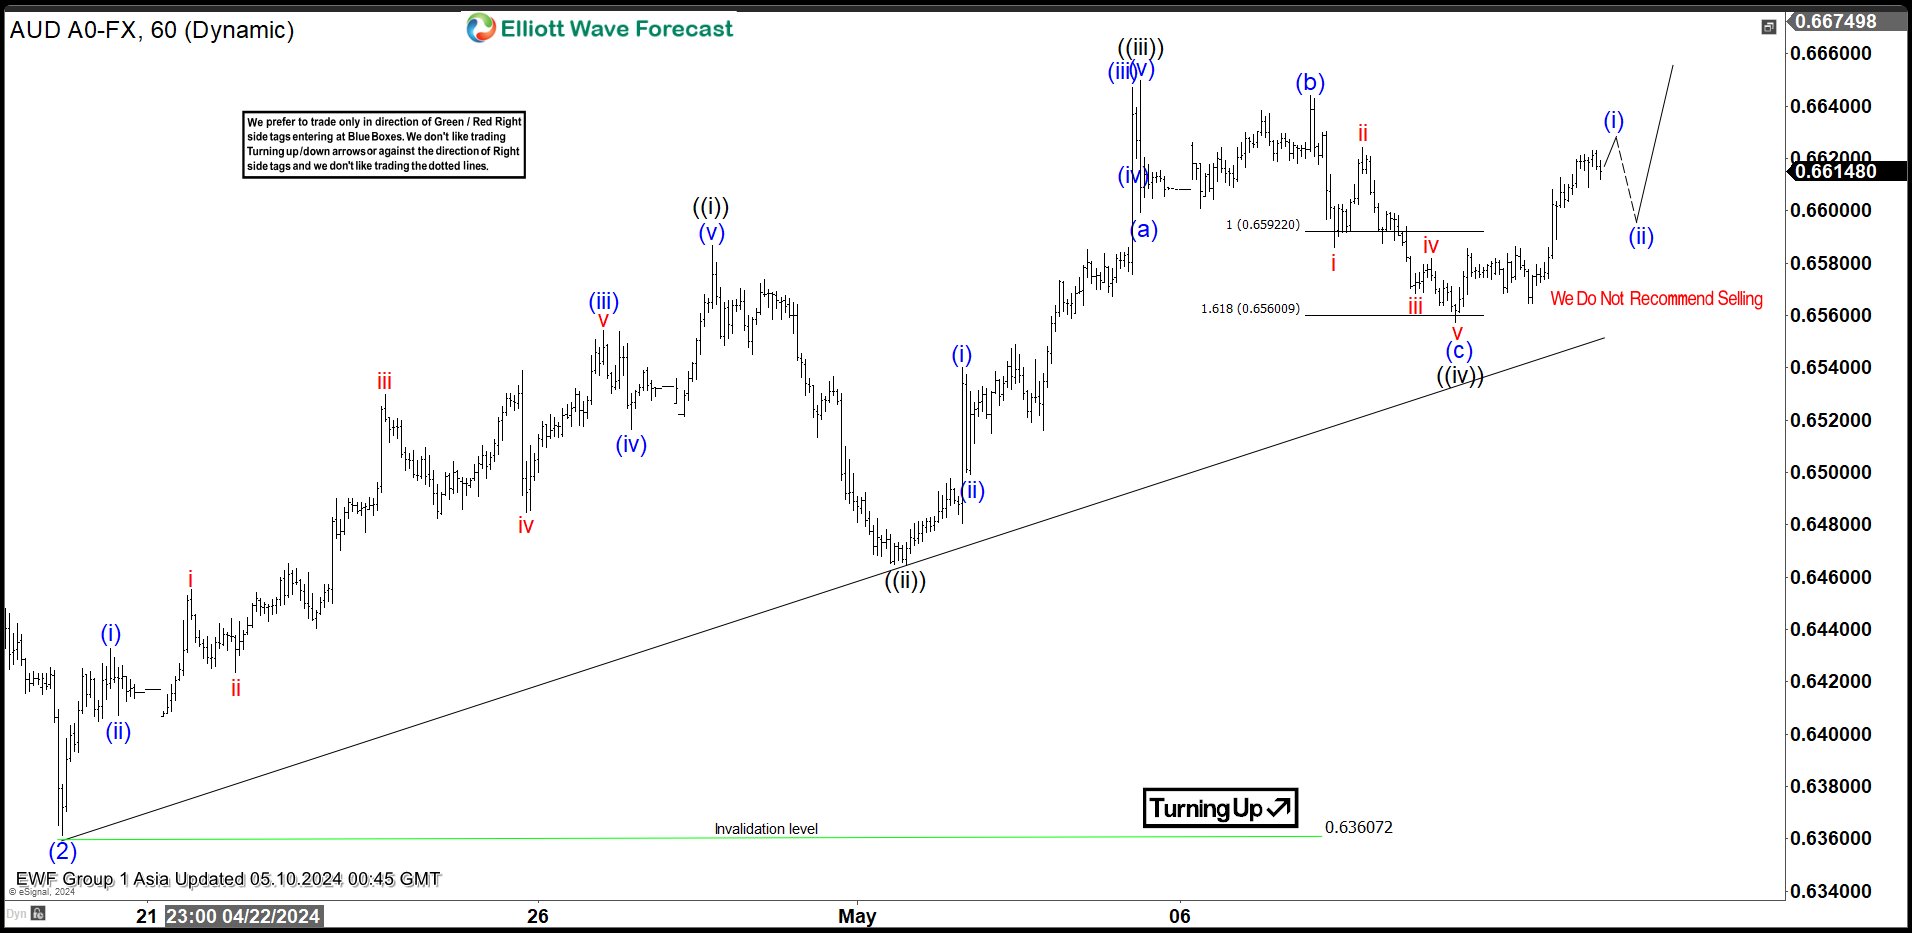 Source: https://elliottwave-forecast.com/news/elliott-wave-expects-audusd-break-higher/ On the date of publication, Elliott Wave Forecast did not have (either directly or indirectly) positions in any of the securities mentioned in this article. All information and data in this article is solely for informational purposes. For more information please view the Barchart Disclosure Policy here. |
|
|
